Abstract
Based on the presence of individuals defecating on the beaches of les Cayes and the mayoral candidate (Fortuné) assertion that all latrines should be replaced with flushing toilets, I set out to find if there is a toilet problem in the city of les Cayes. For this paper, I conducted a survey in the city of les Cayes in august 2020, proceeded to observe the count and proportion data, created a bar graph for counts of the types of toilets available and ran a hypothesis test on the proportion of flushing toilets in the general population. I also created a bar graph and observed the count and proportion data before I created a hypothesis test on the proportion of the population with no access to toilets. Finally, I created a histogram for the number of people living in a household and calculated the mean. I also conducted a hypothesis test for the mean number of people in each household. I came to the conclusion that about 41% of the population of les Cayes have access to flushing toilets. Through further hypothesis testing, I am able to say that about 95% of the population in les Cayes have no access to toilets at all. Finally, through the hypothesis testing, I am 95% confident that the true number of people composing a household in Les Cayes is between 4 and 5 (4.67).
Introduction
The city of Les Cayes lies in the southern department of Haiti. I estimate that about 92,387 people live in the city today. In the city of les Cayes, it is not uncommon to see people defecate by the beach. Also, in 2016, the future mayor of Les Cayes promised to replace all latrines in the city with flushing toilets. Recently, Haiti faced a cholera pandemic that killed thousands hence, it is understandable that the subject of modern toilets has taken a front seat in the general debates. These two observations led me to question the state of toilets in the city of Les Cayes. In this paper, I intend to find out how many people have access to flushing toilets, how many people have access to toilets in general and how many people live on average in a house in Les Cayes.
Data and Methods
For this study, I wanted a confidence level of 95%, a standard deviation of 0.5, and a margin of error (confidence interval) of +/- 5%. Hence, I calculated the sample size using the following formula: Required Sample Size = ((0.5) ² × (0.5) × (1-0.5)) / ((0.05) ²). Therefore, Required Sample Size = 385 respondents.
I needed 385 respondents for this study. I used the simple random sample method to ensure that every inhabitant of the city has a chance of being included in the sample. The second step was to position the investigators in various corners of the city as presented below.
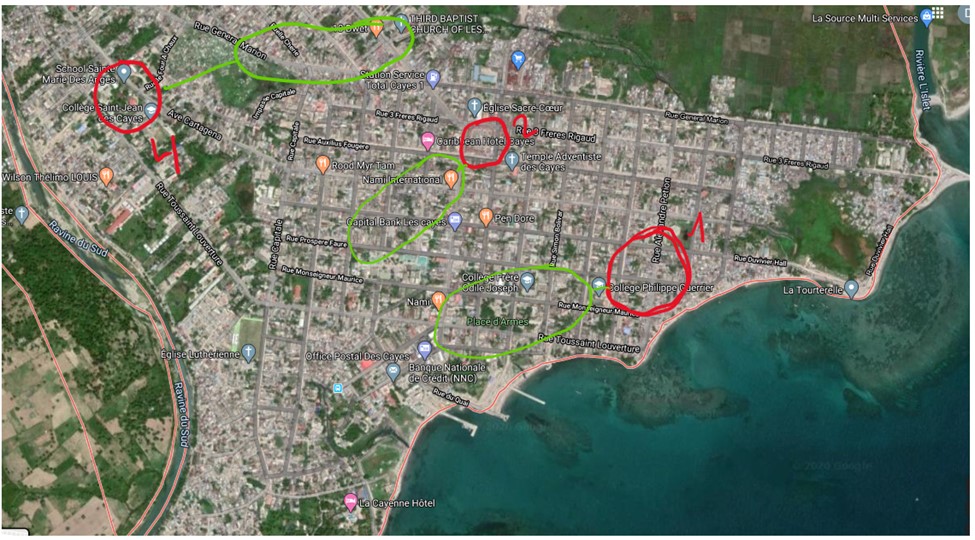
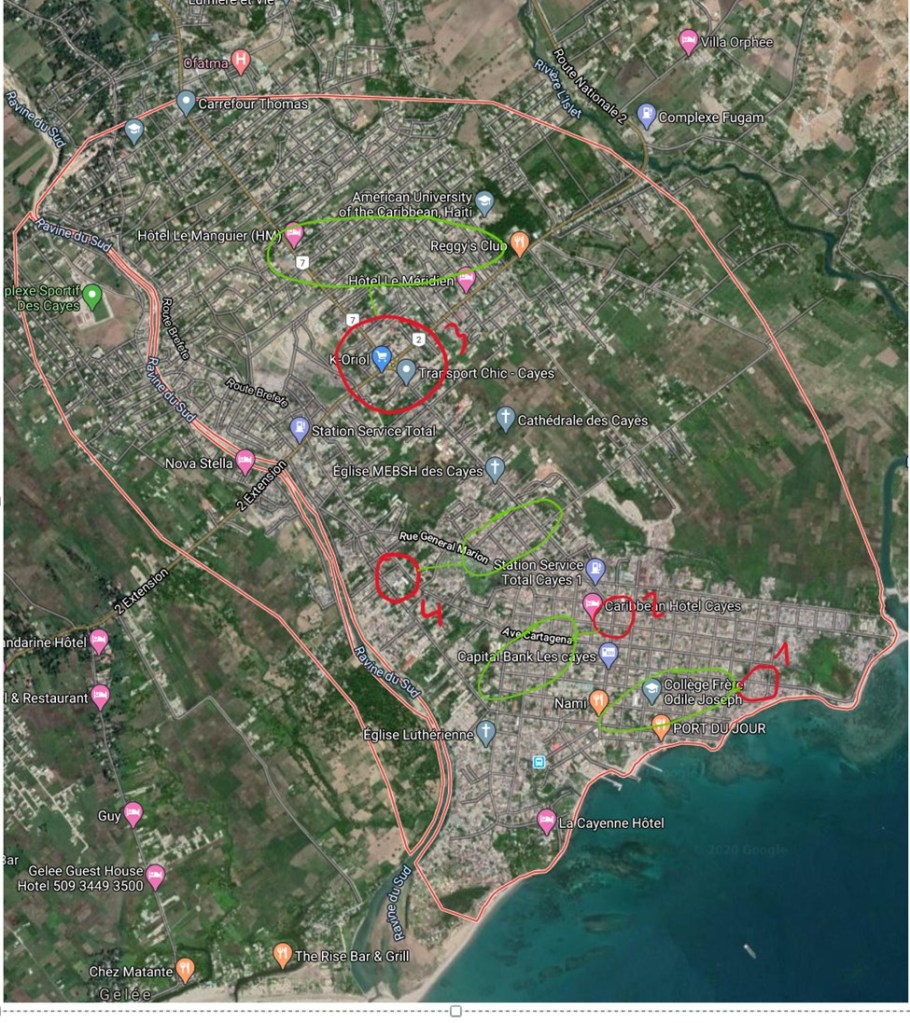
I chose 4 places (in red) in the city to ask the questions:
1. La Savanne
2. The surroundings of the main market (Kay fè)
3. The surroundings of the “Croix des quatres Chemins”
4. The surroundings of “college Saint Jean” (Drum Zone)
I anticipated the presence of possibility outliers in the data collection, so with my team, we planned to interview 400 citizens instead of just 383. The goal was to interview people aged 20 or older.
A team of investigators for data collection was formed in the town of Cayes. It included:
1. An Operations Manager.
2. 8 investigators.
The questions pertaining to this study are the following:
“Do you have a toilet at home/ What type of toilet do you have at home?”
“How many people can live at your house?”
In order to ensure the representativeness of the samples, investigators asked questions to the first person they see. Each survey is conducted at least one minute apart.
To examine the types of toilets that people have access to, I entered all the data under a variable entitled “Toilet” and the entries are “Ijyenik”, “Latrin”, L/I (for Latrin and Ijyenik) and “None”. Despite having questioned 404 citizens, some respondents failed to mention or refused to mention which types of toilets they have access to. Hence, I proceeded to remove total of 3 observations the dataset. In this instance, our variable “Toilet” is categorical and nominal and consists of 401 observations. The first step in this analysis was to create a table of proportions and conduct a hypothesis test for the proportion of the population with access to flushing toilets.
The second step in this analysis also included a table of proportions and of counts, followed by a hypothesis test to determine confidence intervals.
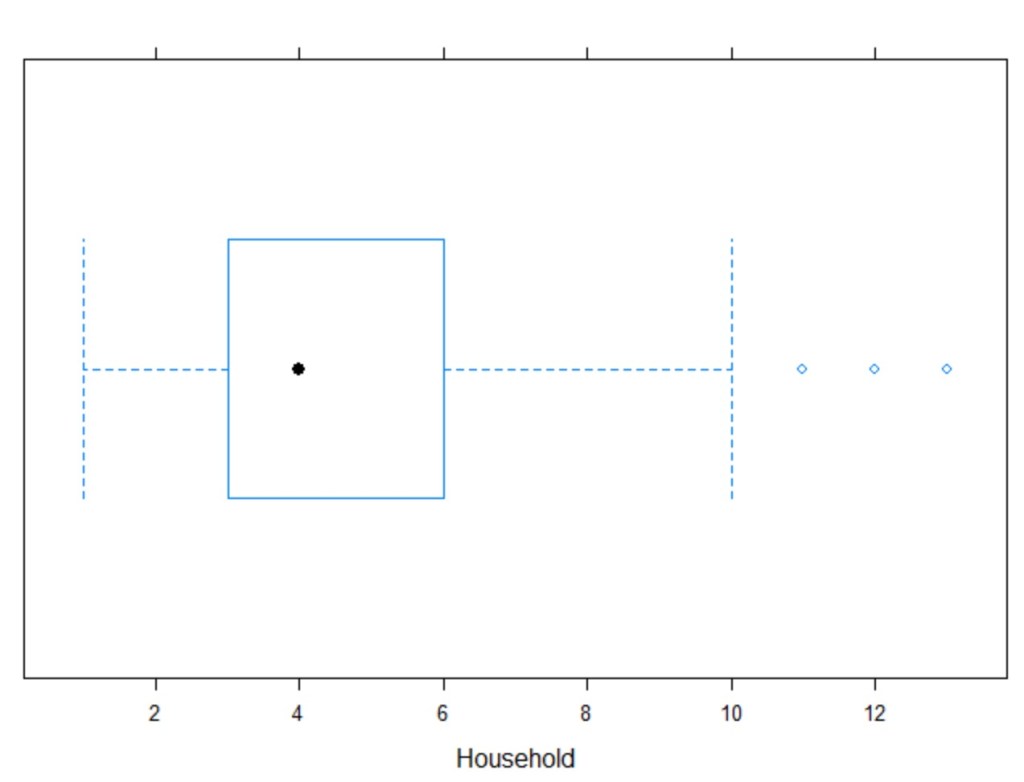
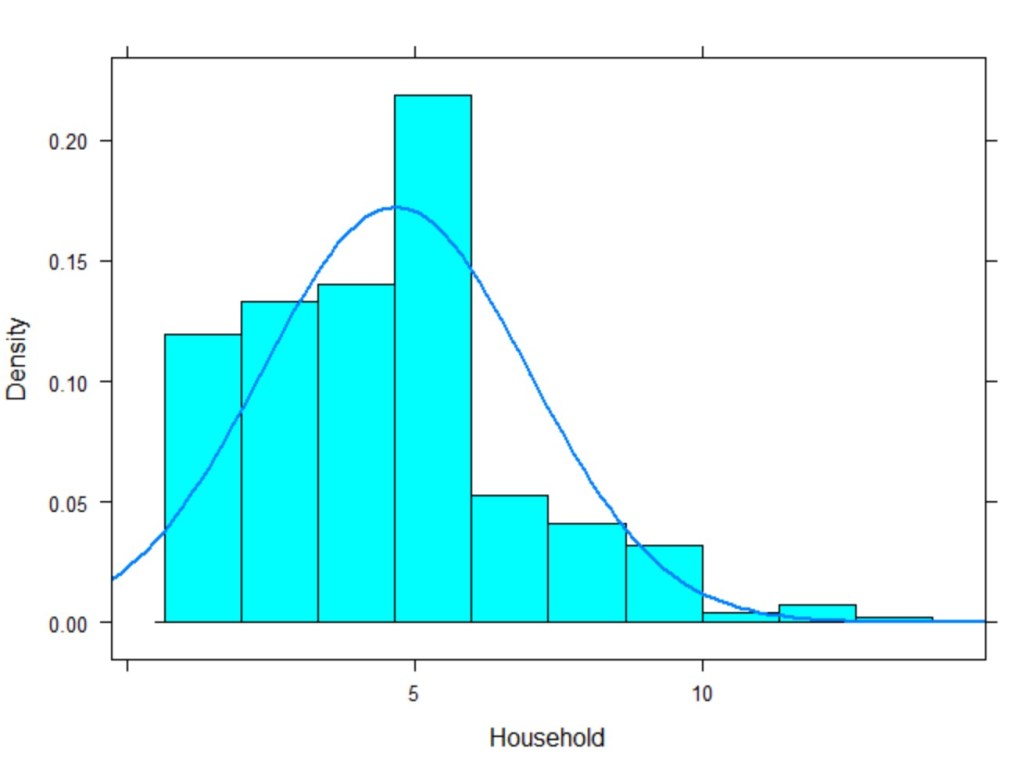
In the third step of this analysis, I proceeded to determine the average number of people living in a household, I entered the data under a variable entitled “Household”. This variable consists of 401 observations that are numerical and discrete. I examined the data for outliers using a boxplot (see figure 1) in order to make sure that some respondents did not over or under exaggerate the number of people living in their household. Some outliers were present but because we assume that the distribution in the population is normal due and the size of our sample is quite important (>30), the 3 outliers were left in the data set. In 2015, the population of Les Cayes was estimated to be around 86,780 people so we know that this sample represents less than 10% of the population and is therefore independent. Our final data set is comprised of 2 variables and 401 observations.
Results
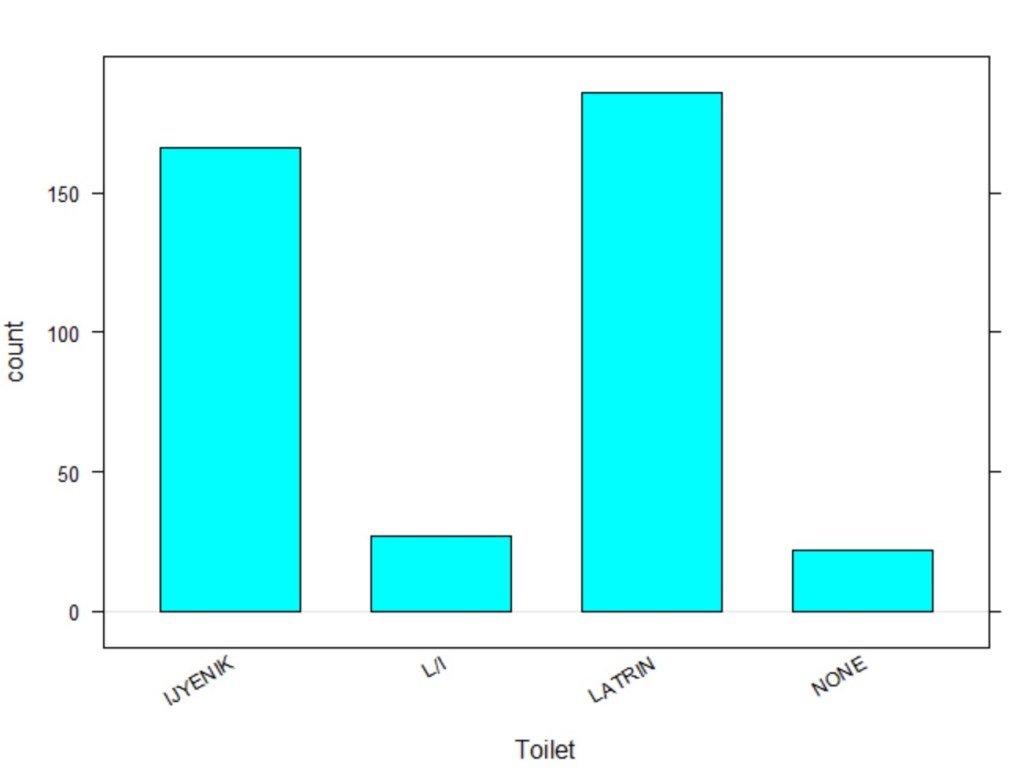
Using Statistical software, I calculated and observed that about 46% of respondents claimed to have access to latrines, 41 % claimed they had flushing toilets at home, about 7 % claimed to have latrines and flushing toilets and 5% reported having no toilets at all at home (See Figure 2). I also created a bar graph of counts in order to visualize the importance of each entry. (See Figure 3)
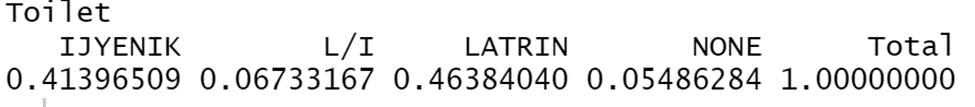
Figure 3
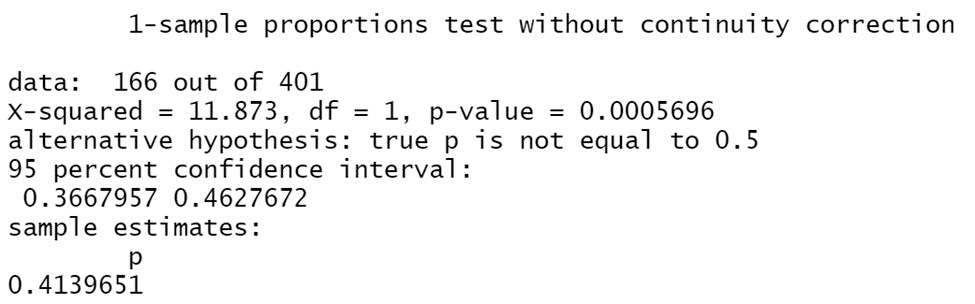
Now that I calculated the proportions from a random sample, I wondered if the numbers found above are just due to sampling variability. I understand that if I repeatedly calculated the proportions from several random samples, it is possible that I could get results that vary from the ones I found above. I want to know if the proportion of people who say they have access to flushing toilets is the same as in the population. To do so I conducted a 1-sample proportions test without continuity correction in order to find a confidence interval and find an estimate of the true proportion.
To conduct such a test, I began by stating my two hypotheses: the null hypothesis (Ho) and the
alternative hypothesis (Ha).
Ho: The proportion of people in the population with access to flushing toilets is 0.5.
Ha: The proportion of people in the population with access to flushing toilets is not 0.5.
The null hypothesis assumes that about half of the population have access to flushing toilets. The alternative hypothesis assumes that the true proportion of the population with access to flushing toilets is not 0.5. Using a α=0.05 as the criteria for statistical significance, I will reject the null hypotheses (Ho) if the p-value is less than our criteria 0.05
Using statistical software, I computed a 1-sample proportions test without continuity correction and got the results below (Figure 4).
Based on the results, P-value= 0.0005696 (Lower than α=0.05), I reject the null hypothesis that the true portion of the population with access to flushing toilets is equal to 0.5. Based on the confidence interval, I am 95% confident that the true portion of the population with flushing toilets is between 0.367 and 0.463. In other words, it ss very plausible that the true portion of the population with access to flushing toilets is 0.41 (about 41%).
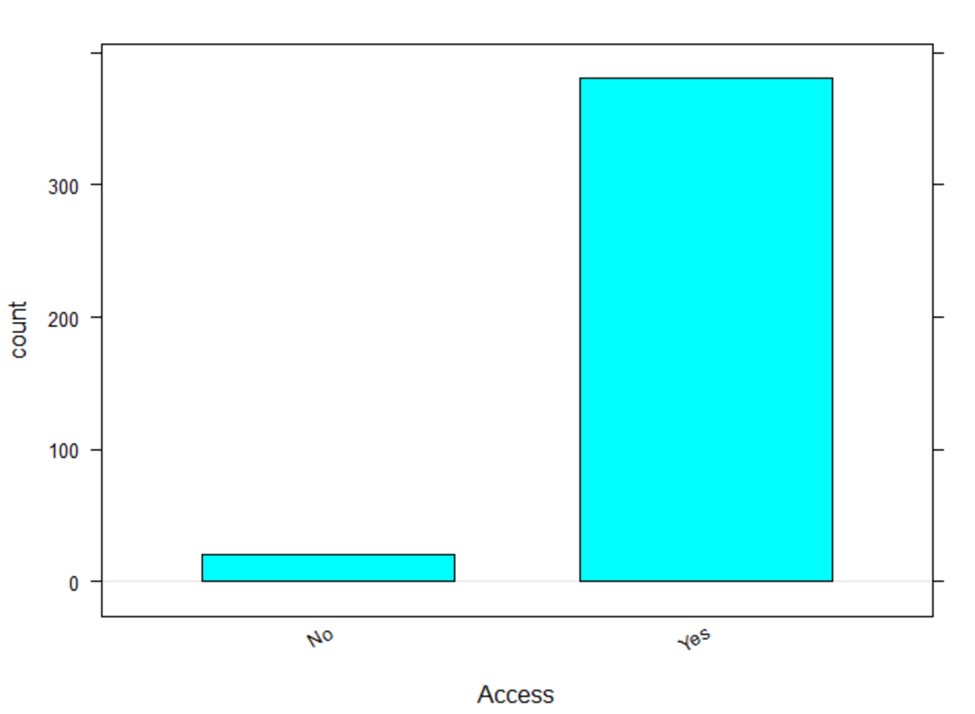
I also needed to compare the number of people with access to toilets to those who don’t have any access. I created a table of counts (Figure 5) and a table of proportions (Figure 6) and found that in my sample, about 95 % of respondents claimed to have access to a toilet at home while 5 % assert not having any toilets at all. I created a bar graph to show the difference between the group with access and the one with no access (figure 7).

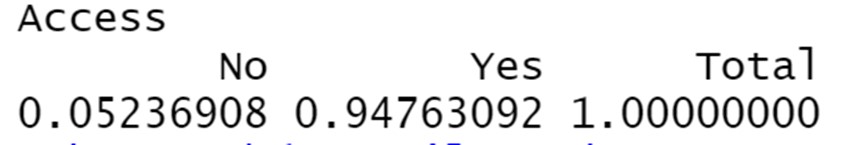
Figure 7
Because of possible sampling variability it is important that I conduct a hypothesis test and determine a confidence interval. To do so, I conducted a one proportion z test.
To conduct the test, I began by stating my two hypotheses: the null hypothesis (Ho) and the
alternative hypothesis (Ha).
Ho: The proportion of people with access to toilets in the population is 0.5
Ha: The proportion of people with access to toilets in the population is not 0.5
The null hypothesis assumes that 50% of the population have access to toilets while the alternative hypothesis assumes that the proportion of the population with no access to toilets is not equal to 50%.
I am using α=0.05 as the criteria for statistical significance. It is important to mention here that I
will reject the null hypothesis (Ho) if the p-value is less than our criteria 0.05.
Using Statistical software, I conducted a 1 sample proportions test and got the results below (Figure 8)
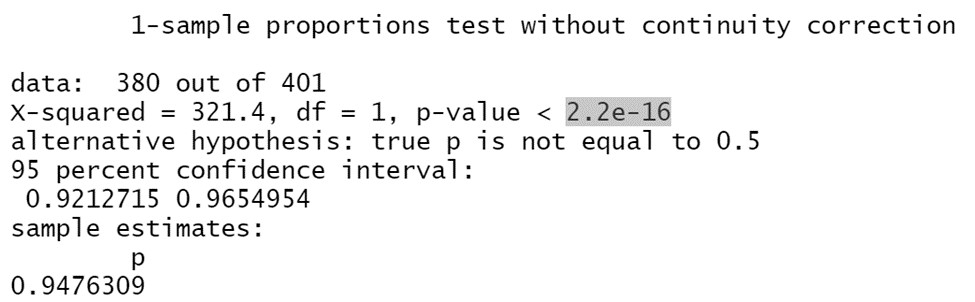
Based on the results, P-value< 2.2e-16 (lower than α=0.05), I reject the null hypothesis that the proportion of the population with access to toilets is 50%. Based on the confidence interval. I am 95% confident that the true proportion of the population with access to toilets is between 0.92 and 0.97. In other words, the true proportion could be 0.95 in the population.
In this study, I also needed to find the average number of people living in each household in the city of Les Cayes. My first action was to look up favorite statistics using statistical software (Figure 9). The results show that in my sample, the average number of people living in a household is 4.67.
Figure 9

I know that there is a possibility that this result is based on sampling variability hence, I will have to conduct a hypothesis test and find a confidence interval. I am making the assumption that this variable is normally distributed in the population. In my sample, the distribution has some positive skew but due to the size of my sample, that can be disregarded (Figure 10)
To conduct such a test, I began by stating my two hypotheses: the null hypothesis (Ho) and the
alternative hypothesis (Ha).
Ho: The average number of people in a household in the population is 4.67
Ha: The average number of people in a household in the population is not 4.67.
Using statistical software, I computed the t-test statistic and got the results below (Figure 11).
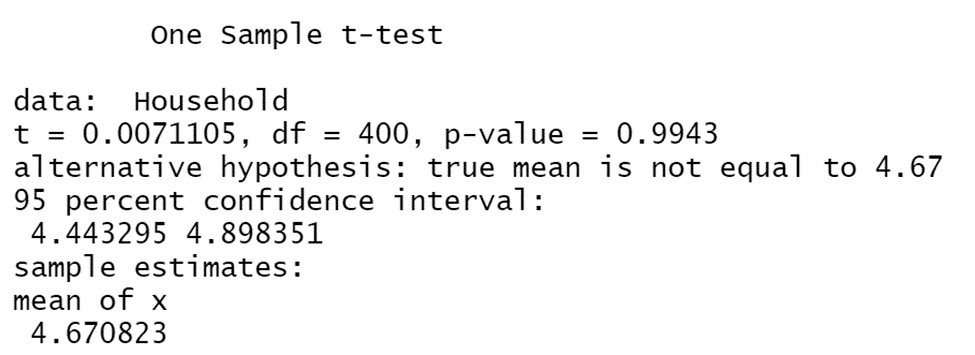
Based on the results, P-value= 0.99 (greater than α=0.05), I failed to reject the null hypothesis that the true average of number of people in a household in the in population is 4.67. Based on the confidence interval, I am 95% confident that the true average number of people in a household in Les Cayes is between 4.44 and 4.90.
Conclusion
In this study, I wanted to find out if there was a toilet problem in les Cayes. I set out to investigate the proportion of the population with access to flushing toilets, the proportion of the population with access to toilets and the average number of people in a household. After getting rid of some observations with missing information, I was left with 2 variables and 401 observations. I proceeded to create a table of proportions for the type of toilets people have access to and conducted a hypothesis test. Based on the confidence interval, I was able to say that I am 95% confident that the true proportion of the population with access to flushing toilets is between 0.37 and 0.46. This led me to the conclusion that a little less than half of the population have access to flushing toilets which also explains the concern of the future mayor of les Cayes.
I also studied the proportion of the population with access to toilets. I created a table of counts and a table of proportions and conducted a hypothesis test. I am able to affirm that I am 95% confident that between .92 and .96 of the population of les Cayes have access to a toilet. This result failed to explain the observation that people defecate on the beaches. It may be that people who do so are not from the city, that they are part of the 5% of the population that do not have access to toilets or simply that people don’t have the possibility to go home when they need to defecate.
Keeping in mind the promise of the mayor to get rid of latrines, I calculated the favorite statistics of my sample for the number of people living in a household. I also conducted a hypothesis test and I am able to say that I am 95% confident that between 4.44 and 4.90 people live in a household in Les Cayes. If I estimate the number of people living in les Cayes to be about 92,287 people and the proportion of people with access to flushing toilets to be about 41%. The mayor would have to help 59% of the population (54,508 people) to gain access to modern toilets. If the average number of people living in a household is 4.67, the mayor’s promise concerns about 11,697 households.
I believe that it is important to point out some limitations of this study. Mainly that despite all our hypothesis testing, there is a 5% chance that our sample means and proportions do not correspond to the true means and proportions of the population. Furthermore, because assertions were not verified during our survey, there is always a possibility that respondents did not accurately report the type of toilets that they have at home or if they have any all. Toilets can be a very sensitive topic but we expect the size of our sample to compensate for the possibility of misreporting. Further research could look more closely at how toilets in the city could be modernized and how more public toilets could curb open air defecation.

Leave a comment